


How Efficient Are Wind Turbines in 2026? A Data-Driven Comparison to Solar and Fossil Fuels
Modern wind turbines in 2026 convert 20% to 50% of wind energy into electricity. This is a notable improvement from the previously cited 20-40% range in 2025, driven by 11 MW offshore turbines (like Siemens Gamesa SG 11.0-200 DD), advanced aerodynamics, and AI-driven blade pitch optimization.
In 2026, wind turbine efficiency varies significantly based on wind speed, turbine design, location, and grid integration, with peak efficiency reaching 44-48% at design wind speeds (typically 6-9 m/s) and dropping to around 20% at lower wind speeds, while efficiency decreases at higher wind speeds as turbines intentionally "spill" energy to prevent mechanical overload and reduce noise.
This guide provides a data-driven comparison of wind turbine efficiency against solar power and fossil fuels, exploring cost-effectiveness, capacity factors, and technological innovations shaping the future of wind energy. How does wind power stack up in 2026? Let’s dive into the numbers.
Wind Turbine Efficiency: Key Concepts Explained
The Betz Limit: Why Wind Turbines Can’t Reach 100% Efficiency
The Betz Limit is the theoretical maximum efficiency of 59.3% for a wind turbine. The theory published in 1919 by the German physicist Albert Betz states that a wind turbine can’t reach 100% efficiency because extracting all the kinetic energy from the wind would stop the airflow and prevent further energy extraction.
A wind turbine extracts energy by slowing down incoming wind, converting kinetic energy into mechanical power. If a wind turbine reaches 100% efficiency, then all of the wind would have to stop completely upon contact with the turbine, which is practically impossible. If a wind turbine were to achieve 100% efficiency, the wind would stop completely upon contact, preventing further airflow and rendering energy extraction impossible. This is why “Betz Law” or “Betz limit” suggest that a wind turbine can’t reach 100% efficiency.
Real-World Efficiency: What to Expect (35–50% Capacity Factors)
Wind turbine capacity is ever evolving; the average capacity of an onshore wind turbine is 2.5 MW to 3 MW, and an offshore wind turbine produces 4 MW to 15 MW of electricity. In the real world, the technological and artificial intelligence boom is guiding the modern wind turbine near to the Betz limit.
The average efficiency of offshore wind turbines in 2025 is around 30 to 50 percent, and the efficiency of onshore wind turbines is calculated at 25 to 35 percent. The real-world efficiency of a wind turbine is calculated by the capacity factor of a wind turbine. The wind turbine capacity factor is its average power output divided by its maximum power capability.
Trusted by Leading Manufacturers & EPCs
Find The Latest Offshore Wind Farm Projects Around The World
Gain exclusive access to our industry-leading database of Offshore Wind Farm Projects opportunities with detailed project timelines & stakeholder information
No credit card Up-to-date coverage
How Energy Efficient are Wind Turbines in Real World
How energy efficient are wind turbines? Let’s explore this with a real world example. Here is the step-by-step calculation of the efficiency percentage of an 18-MW Mingyang, one of the largest wind turbine models in the world:
The rated power of the wind turbine is 18 MW. The annual energy production is 80 GWh at an average optimal wind speed of 8.5 m/s.
Step 1: The maximum possible energy output is calculated as the rated power multiplied by the number of hours in a year.
Potential energy = 18 MW x 8760 h = 157680 MWh = 157.68 GWh
Step 2: Calculating the capacity factor
The capacity factor is the actual energy production divided by the potential energy production.
Capacity factor= 80 Gwh / 157.68 Gwh = approximately 0.507
Step 3: We get the efficiency of the wind turbine by multiplying the capacity factor by 100.
The energy efficiency of the 18 MW Mingyang wind turbine is approximately 50.7%.
How Location, Size, and Tech Impact Output
Wind turbine location, size, and technology are the biggest factors that affect wind turbine efficiency. The location of a wind turbine is directly related to the optimal wind presence. The higher elevation of the turbine can result in stronger and more consistent wind.
Recent data show that productivity increases by 34% if the height of the wind farm is doubled from the ground. Offshore locations are expected to generate a minimum of 1.7 times the energy output than onshore wind energy because the wind flows freely with less influence in the deep oceans.
The size of a wind turbine consists of two components: hub height and rotor diameter. Higher hub heights expose the turbine to higher wind speeds throughout the year. Also, larger rotor diameters allow wind turbines to sweep more area, which allows them to capture more wind and produce more electricity. The average rotor diameter of a wind turbine in the United States increased from 115 meters (380 feet) in 2013 to 133.8 meters (~438 feet) in 2023.
Wind vs. Solar: Which Is More Efficient for Your Needs?
Energy Output per Dollar: Wind Turbines vs. Solar Panels
The comparison of wind turbines and solar panels in terms of energy output per dollar gives an idea for investors to choose the best option. Data from the U.S. Energy Information Administration (EIA) shows onshore wind’s overnight capital cost is at USD 1,718/kW with a 37% capacity factor, while solar PV with tracking costs USD 1,327/kW with a 20% capacity factor.
Onshore wind turbines generate approximately 3,241 kWh per installed kW annually, compared to 1,752 kWh per installed kW for solar. Also, LCOE (levelized cost of energy) calculations estimate wind at USD 0.54/kWh versus solar at USD 0.77/kWh, suggesting wind energy provides a better return on investment per dollar spent.
However, regional factors, incentives, and technology advancements, such as offshore wind with up to 60% projected capacity factors, can influence cost-effectiveness, requiring site-specific evaluations for optimal investments. Here is the breakdown of wind power according to cost per KW and capacity factor.
Type | Cost per KW | Cost per MW/h | Capacity factor |
Onshore wind power | USD 1,718 | USD 27–75 | 18–48% |
Offshore wind power | USD 4,833–6,041 | USD 67–146 | 29–52% |
Solar photovoltaic | USD 1,327 | USD 31–146 | 12–30% |
Solar PV with storage | USD 1,748 | USD 53–81 | 20–31% |
Land Use Comparison: Space Requirements for Equal Power
To assess efficiency, we must consider land use requirements for wind and solar energy. The land usage requirements for renewable energy sources vary significantly based on technology, installation type, and project scale. Photovoltaic solar requires more land than wind power to generate the same amount of renewable electricity. Let’s dive into it.
For instance, solar panels made from cadmium require less energy and materials than traditional silicon panels, leading to lower land use per unit of energy produced. The installation type also matters, as rooftop solar panels minimize additional land use by utilizing existing structures, while ground-mounted solar farms require dedicated land.
Onshore wind farms allow for dual land use, enabling agricultural or other activities between turbines. Offshore wind farms further minimize land use concerns by occupying marine space instead. The land footprint of wind energy projects varies widely.
For example, the Roscoe Wind Farm in Texas uses approximately 184 m² per MWh, allowing farmers to continue operations while generating additional income. In contrast, denser wind farms, such as Fântânele-Cogealac in Romania and Tehachapi Pass in California, prioritize energy generation, requiring as little as 8 m² per MWh.
Here is the data that provides a direct comparison of land use efficiency between wind and solar energy sources:
Energy Source | Land Use (m² per MWh) |
Onshore wind (direct impact area) | 0.4 m² per MWh |
Onshore wind (project site area) | 8.4 – 247 m² per MWh |
Solar photovoltaic (PV), silicon (rooftop) | 3 m² per MWh |
Solar photovoltaic (PV), silicon (on-ground) | 19 m² per MWh |
Solar photovoltaic (PV), cadmium (rooftop) | 1.2 m² per MWh |
Solar photovoltaic (PV), cadmium (on-ground) | 12.6 m² per MWh |
Source: ourworldindata.org
Wind vs. Fossil Fuels: Cost, Reliability, and Emissions
Levelized Cost of Energy (LCOE): Wind vs. Coal
To calculate the efficiency of wind energy and fossil fuels, we use the Levelized Cost of Energy (LCOE) as a key metric. Based on data from the International Renewable Energy Agency (IRENA) report "Renewable Power Generation Costs in 2023", the global weighted average LCOE for onshore wind in 2023 was approximately USD 0.033 per kWh, while offshore wind stood at USD 0.081 per kWh.
In contrast, coal's LCOE ranges from USD 0.05 to USD 0.15 per kWh, depending on region and carbon pricing, while gas (combined cycle) ranges from USD 0.045 to USD 0.10 per kWh. These fossil fuel costs are sensitive to fuel price volatility and environmental regulations, which often increase their LCOE over time.
Wind energy's lower LCOE, especially for onshore installations, highlights its economic advantage over coal and gas in many markets. For example, IRENA notes that new wind projects in 2023 were cheaper than the operating costs of existing coal plants in some regions.
Lifecycle Efficiency and Carbon Footprint
Wind turbines outperform coal in terms of lifecycle efficiency and carbon footprint. On a lifecycle basis, wind power emits far less carbon dioxide than fossil fuels per kilowatt-hour of energy generated. The National Renewable Energy Laboratory (NREL) estimates that the average lifecycle emissions of offshore and onshore turbines are 13 g CO₂q/kWh (CO₂ equivalents produced per kilowatt-hour of electricity).
In contrast, natural gas emits 486 g CO₂-eq/kWh, while coal reaches 1001 g CO₂-eq/kWh. This means that wind energy’s lifecycle emissions are roughly 1/77th that of coal.
Trusted by Leading Manufacturers & EPCs
Find The Latest Offshore Wind Farm Projects Around The World
Gain exclusive access to our industry-leading database of Offshore Wind Farm Projects opportunities with detailed project timelines & stakeholder information
No credit card Up-to-date coverage
Emerging Tech Boosting Wind Efficiency (2026 Updates)
Superconducting Generators: Pushing Wind Efficiency to Betz Limit
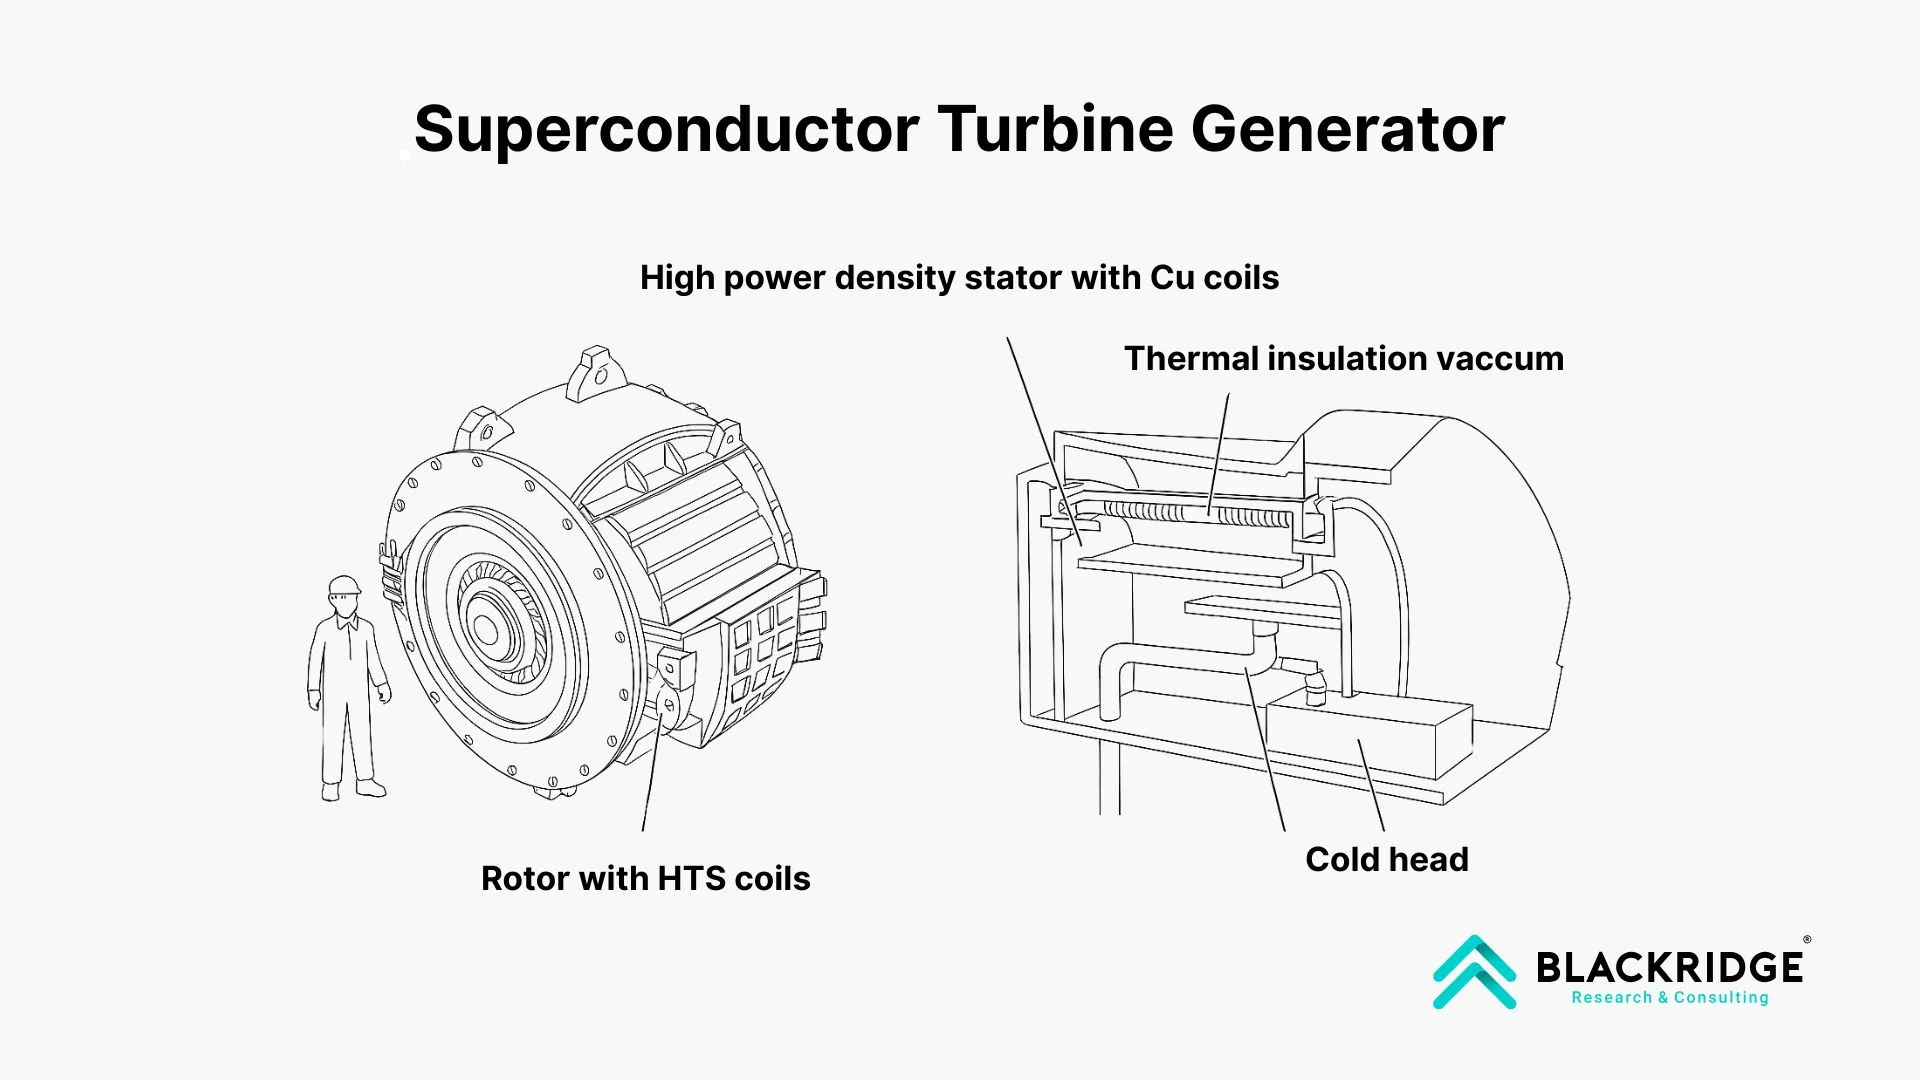
We have already explored the Betz limit and the maximum theoretical efficiency for a wind turbine. In 2025, new technologies like superconducting generators enhance efficiency and power output, bringing wind turbines closer to their theoretical maximum efficiency. Superconducting generators use superconducting materials to achieve significantly higher efficiencies and power densities compared to conventional generators.
These generators reduce the size and weight of wind turbines while increasing their energy output. This groundbreaking technology can be utilized in offshore wind farms where space and weight are critical factors.
On January 20, 2021, the U.S. Department of Energy (DOE) announced an additional USD 20.3 million in funding for one of the top wind turbine manufacturers in USA, General Electric (GE). The fund was allocated to build and test a high-efficiency, ultra-light, low-temperature superconducting generator (SCG) for wind turbines. This project, which eliminates reliance on rare earth materials, is expected to lower costs and enable the development of larger, more powerful wind turbines.
Similarly, the EcoSwing consortium in Denmark successfully tested a 3.6 MW superconducting wind turbine using rare earth barium copper oxide (ReBCO) high-temperature superconductors (HTS). The turbine operated for over 650 hours in grid conditions, proving the feasibility of superconducting generators in real-world wind farms.
AI-Optimized Wind Farms: Reducing Curtailment Losses
Curtailment occurs when wind energy production exceeds grid demand or transmission capacity, which leads to wasted energy and financial losses. AI-driven solutions can reduce curtailment by improving forecasting, grid integration, and operational efficiency.
Here are the advantages of integrating AI in wind farm operations:
Advanced Energy Forecasting for Grid Stability: A recent study by NREL shows that AI-driven forecasting can improve energy output predictions by up to 20%, optimizing grid balancing and reducing unnecessary shutdowns.
Dynamic Grid Integration and Smart Dispatching: A Recent study by the Technical University of Munich shows that AI-based smart grids improve energy dispatching efficiency by 15%, preventing surplus energy from being wasted. Also, Intelligent scheduling prevents power blackouts and reduces reliance on fossil fuel backup generation.
Real-Time Turbine Optimization to Match Demand: Machine learning models fine-tune turbine blade pitch, yaw angles, and rotational speed to optimize energy capture while preventing overproduction and increasing energy efficiency by 10-20%.
Energy Storage and AI-Powered Load Balancing: AI enhances the integration of battery storage systems by predicting surplus wind electricity generation and automatically redirecting excess power to storage. This prevents energy wastage and ensures continuous power supply during low-wind periods.
Are Wind Turbines Cost-Effective? A Financial Perspective
Homeowners: ROI Calculator for Small Wind Turbines
Economics of a Potential Wind Energy Project
Investing in a wind energy project involves significant upfront costs, but on a long term it generates financial benefits. Understanding the economics of wind energy requires analyzing key cost components, including turbine prices, installation expenses, operations and maintenance (O&M) costs, and power purchase agreements (PPAs).
Wind Turbine and Installation Costs: The cost of wind turbines in 2025 is between USD 850 and USD 950 per kilowatt (kW). Land-based wind energy costs USD 1200/kW to USD 1800/kW. Offshore wind energy costs between USD 3,500/kW to USD 4,000/kW.
Operations and Maintenance Costs: In 2025, land-based wind farms had an average O&M cost of more than USD 40/kW annually, and offshore wind farms generally have higher maintenance costs due to harsher conditions.
Wind Energy Pricing and Financial Incentives: The LCOE of wind energy in 2025 is given in the table below:
Wind Energy Type | Average cost (USD/MWh) |
Land-based wind energy | USD 39/MWh |
Fixed-bottom offshore wind farms | USD 95/MWh |
Floating offshore wind farms | USD 145/MWh |
Small distributed wind systems (Residential) | USD 235/MWh |
Small distributed wind systems (Commercial) | USD 163/MWh |
Large distributed wind energy | USD 78/MWh |
Conclusion: Is Wind Energy an Efficient and Sustainable Solution?
Wind energy in 2025 continues to be a highly efficient and sustainable power source, outperforming fossil fuels in cost-effectiveness and environmental impact. While wind turbines operate within the limits of physics, technological advancements such as AI optimization, superconducting generators, and improved turbine design are pushing their efficiency closer to theoretical maximums.
Compared to solar energy, wind energy often provides a higher capacity factor and better energy output per dollar spent, especially in offshore locations. Additionally, wind farms offer land-use advantages, allowing dual-purpose use for agriculture or remaining entirely offshore. When compared to fossil fuels, wind power boasts lower lifecycle emissions, a competitive LCOE, and decreasing operational costs.
As the global wind turbine market evolves, wind energy’s role in the global transition to renewables is only set to grow. With continued investments in grid integration, energy storage, and policy support, wind power remains one of the most promising solutions for a cleaner and more sustainable energy future. Whether for large-scale projects or distributed generation, the data is clear: Wind energy is a smart, scalable, and increasingly efficient choice for powering the world.
Unlock Global Offshore Wind Farm Business Opportunities!
Collaborate with key decision-makers in offshore wind farm projects worldwide. Gain exclusive access to our comprehensive Offshore Wind Projects & Tender Database and enjoy benefits such as:
Regular updates on global offshore wind projects and tenders
Exclusive access to our Offshore Wind Database
Insights into in-progress and completed projects
Essential details, timely updates, and key stakeholder contacts
Expert analysis on industry trends and developments
Start your free demo today and elevate your business!


Leave a Comment
We love hearing from our readers and value your feedback. If you have any questions or comments about our content, feel free to leave a comment below.
We read every comment and do our best to respond to them all.